Excel中经常需要使用到自动求和公式,自动求和具体该如何操作呢?接下来小编举例简单的例子告诉大家excel设置自动求和公式的方法。excel设置自动求和公式的方法设置自动求和公式步骤1:将鼠标放在要求和数据区域的紧挨着的下面一个单元格,如下图的D10单元格,然后点击【开始】-【自动求和】按钮就可以自动求D......
excel 两轴柱形图制作实例教程
Excel函数
2021-11-25 12:08:01
下面的截图是excel两轴柱形图的源数据。
 最终制作出来的excel两轴柱形图效果如下:
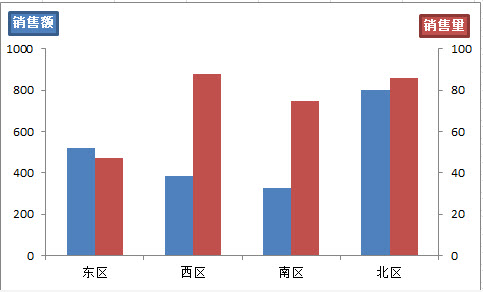 因两系列数值相差较大,直接绘制柱形图,对于数据小的系列,值甚至不可见。解决方案为将2系列分别绘制在2个坐标轴上。excel两轴柱形图解题步骤如下:1、绘制柱形图 选取A1:C5区域,直接插入柱形图,删除图例、网格线; 数值轴最大值固定在1,000,主要刻度单位200;
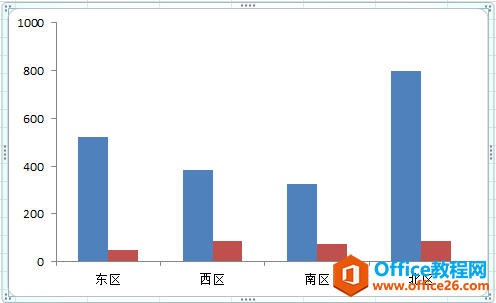 2、“销售量”系列调整到次坐标轴 先选取图表,图表工具-布局-当前所选内容-系列“销售量”-设置所选内容格式-系列绘制在次坐标轴
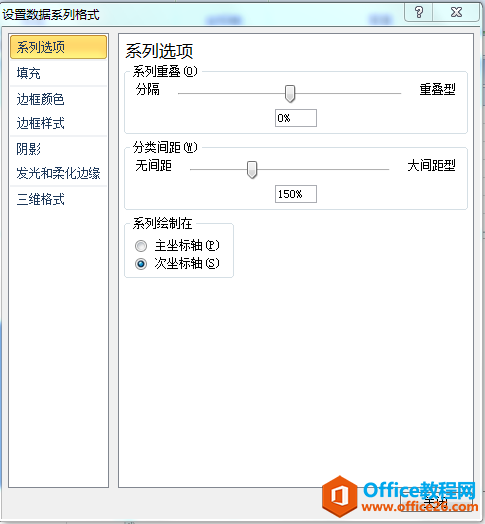 此时得到的图表如下图:
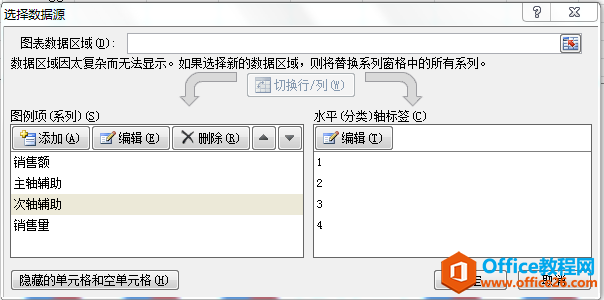
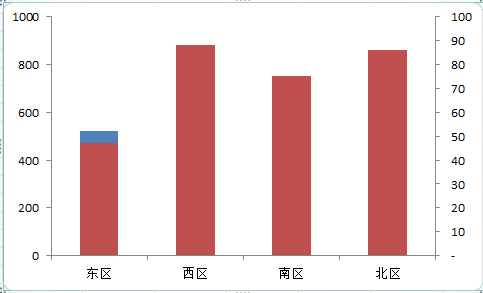 3、添加辅助数据系列 图表工具-设计-数据-选择数据-添加,分别添加2个空的数据系列。
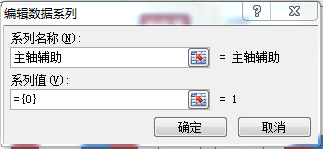
 此时得到的图表如下图:
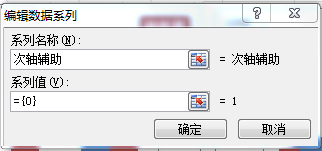
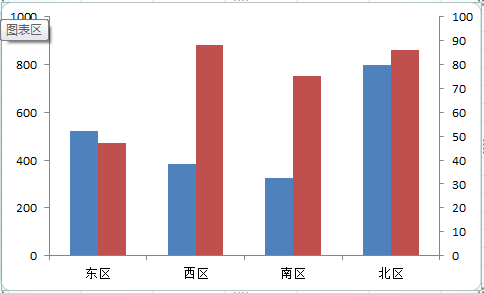
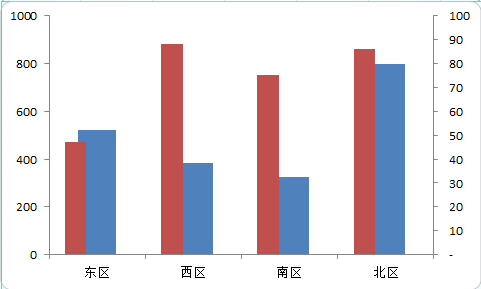 4、调整各系列坐标轴及系列先后顺序 因之前设置过系列“销售量”在次轴,所以新添加的两个辅助系列全部都在次轴,只需要将系列“主轴辅助”调增到主轴,此时图表如下:
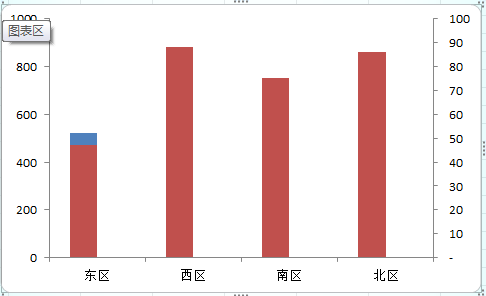
图表工具-设计-数据-选择数据,调整各个数据系列的顺序,使系列“主轴辅助”在系列“销售额”后面,系列“次轴辅助”在系列“销售量”前面。
此时图表已基本完成,如下图:
 5、图表美化
设置次轴的刻度值。因有两个系列在不同的坐标轴上,可设置坐标轴标题等。
标签: excel两轴柱形图
相关文章